COVID-19 Wastewater Surveillance Data Tracker
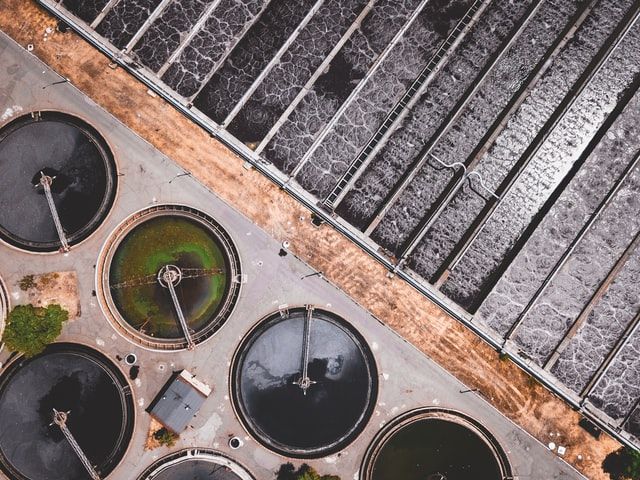
Last week, the CDC announced the launch of a new COVID data portal. The wastewater surveillance map shows how COVID levels in a population's refuse change over time in the 232 sites where that data is collected. The CDC says that data can indicate whether COVID levels are going up or down in sewage, which has been proven to correlate with an area's overall COVID levels. If a person has contracted COVID-19, it's common for the virus's RNA to show up in that person's waste. This viral "shedding" can happen before a person even starts showing actual symptoms. The CDC and its municipal partners have realized that monitoring wastewater is a useful way of forecasting COVID trends.

